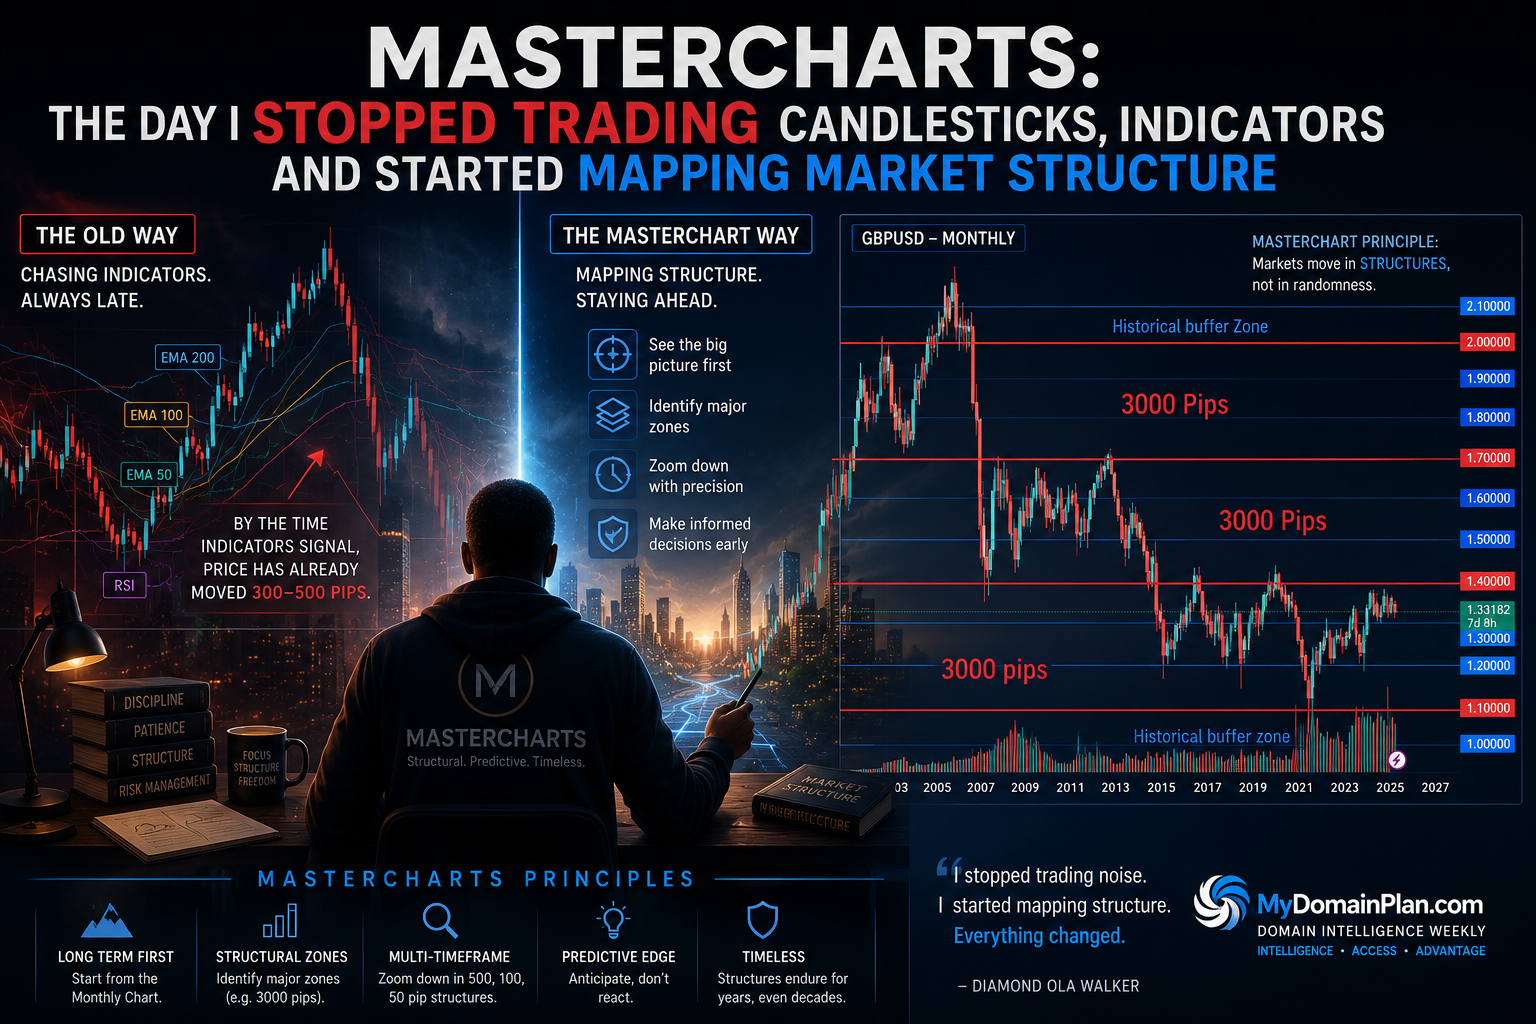
For years, I traded the way most people do: relentlessly chasing indicators. Like countless others around the world, I immersed myself in Moving Averages, RSI, MACD, Bollinger Bands, Stochastic Oscillators, Fibonacci retracements, Elliott Waves—every new tool that promised to unlock the market’s secrets. Each one felt like the missing piece that would finally tilt the odds in my favour. Yet something always nagged at me. The market moved first. The indicators followed only afterward. That simple but persistent observation became the turning point. As a result, it gradually steered my research away from reactive signals and toward something far deeper. Over time, this shift gave birth to the MasterCharts Trading System.
For most people, trading looks deceptively simple. Open a chart, draw a few lines, buy, sell, repeat. But anyone who's actually spent real time in the markets knows that's not even close to the truth. Markets are some of the most complex systems humans have ever built — every single price move is the sum of millions of decisions made by governments, central banks, institutions, hedge funds, corporations, and individual traders all at once, all over the world. Trying to hold all of that in your head at the same time is a losing game. Years ago, I came across a claim that mastering forex takes something like 100,000 hours of study. Whether that exact number is real or not doesn't matter. The point underneath it does: financial markets are extraordinarily, almost absurdly, complex.
Most traders start small, five-minute charts, fifteen-minute charts, chasing the noise. I went the other way. I started with the monthly chart, then the weekly, and only after that did, I let myself look at the daily. I didn't want short-term volatility dictating how I thought. I wanted long-term structure doing that instead. Over time, this produced what felt less like ordinary charts and more like market maps, some of which stayed relevant for years. Even now, plenty of the levels I mapped out more than a decade ago still influence price behaviour today. Using the GBPUSD MasterChart as a case study, think about what has happened since 2011:
- Brexit
- COVID-19
- Multiple financial crises
- Record inflation
- AI revolution
- Quantitative easing
- Quantitative tightening
- Interest-rate shocks
- Ukraine war
- US-Israel-Iran War
- Massive algorithmic trading growth
Yet, many of those long-term zones still matter. In fact, GBPUSD has been trading within the 3000 pips zone since around 2015. That kind of durability is what convinced me I had found something actually worth writing down.
It all started with a quiet but powerful question: What if I have been asking the wrong thing all along? Instead of wondering, “What is this indicator telling me?” I began asking, “Where is the market likely to react *before any indicator confirms it? That subtle shift in perspective changed everything. After all, most technical indicators are, by design, lagging. In fact, experienced traders referred to the as lagging Indicators They are mathematical derivations based on past price action. Consequently, a 50-day, 100-day, or even 200-day moving average might finally signal a trend only after price has already travelled hundreds of pips. By then, the real move has already unfolded. At that point, I no longer wanted to explain what had already happened. Instead, I wanted to understand the market’s underlying architecture - the structure that existed independently of any oscillator or crossover.
Around 2008, I started asking a different question. Instead of trying to analyse every candle, every headline, every indicator, I wondered whether there was a simpler structure hiding underneath all that noise. That question ended up shaping years of my life. My research eventually branched into several frameworks — MasterCharts, the Concrete Zone Trading System, 1,000-Pip Price Action Analysis, 50-Pip Price Action Analysis, and a set of Daily RSI frameworks — each one tackling a different slice of market behaviour. But one of them rose above the rest.
Markets were not moving randomly. In fact, they organized themselves into large, consistent structural zones. On GBP/USD, for instance, the market repeatedly respected major zones roughly 3,000 pips apart. Within these broader frameworks, I discovered nested subdivisions i.e. monthly, weekly, daily, and intraday structures—each inheriting its behaviour from the larger one above it. As a result, what I once saw as chaotic price action gradually revealed itself as a hierarchy of interconnected spatial structures. The market was not just reacting; it was remembering.
At that time, I believed I had discovered a better way to analyse currency markets. What I did not realise at the time was that I had stumbled onto something much broader: a way of understanding how complex systems organise themselves. That insight eventually led me beyond forex, into Bitcoin, premium domains, artificial intelligence, and digital assets. Looking back today, MasterCharts was never just a trading methodology. It was the first chapter of a much larger story..
When I introduced the MasterCharts concept in 2011, I often joked that these levels would remain relevant for fifty years unless something extraordinary happened to the global economy. At the time, it sounded like an exaggeration. Fifteen years later, after Brexit, a global pandemic, unprecedented monetary interventions, geopolitical conflicts, and the rise of artificial intelligence, many of those same structural zones continue to influence market behaviour. Looking back, I now realize I was observing something much deeper than support and resistance. I was observing Structural Persistence.
MasterCharts was never built to predict the next move. Its ambition was bigger than that. It was trying to map the long-term structural framework markets actually operate inside. While most traders were locked in on the next 20 or 50 pips, I got obsessed with price behaviour across thousands of pips and years at a time. The deeper I studied historical charts, the more a pattern kept resurfacing, major currency pairs kept respecting huge structural zones, support and resistance showed up around broad price regions rather than random lines, and the market started to look far more organized than most traders gave it credit for. That observation became the seed of the entire MasterChart concept.
When I turned my attention to Bitcoin, there was not yet enough history to map spatial structures in the same way. So, I asked a different question: What are the structural forces shaping Bitcoin itself? That inquiry eventually led to The Five Circles of Bitcoin. In a similar way, the same structural thinking now guides my work in Domain Intelligence. There, I examine digital real estate not through fleeting trends but through the enduring frameworks that will define tomorrow’s AI economy. Furthermore, it underpins my emerging concept of AI First Gates - the idea that premium domains will become the strategic gateways through which AI systems, businesses, and entire industries are discovered and accessed.
Different fields, to be sure. Yet the same core principle applies: understand the structure first, and the movement becomes far clearer. Ultimately, this article is not really about Forex. Rather, it is about how real breakthroughs happen. Progress often arrives not from discovering a better tool, but from asking a better question. That lesson has stayed with me across every domain I have explored - currencies, Bitcoin, premium domains, and the future of artificial intelligence. No matter the subject, I always start in the same place: What is the underlying structure? Because once you truly see the structure, the future becomes much easier to read..
Looking back, I no longer see MasterCharts as being only about forex. It was about a broader principle: complex systems often appear chaotic up close, but when viewed from a distance, clear structures begin to emerge. The same pattern appears in technological innovation, business cycles, artificial intelligence, and even the evolution of premium digital assets. The real skill is not predicting the next candle; it is learning to separate short-term noise from long-term direction.
That way of thinking never really left me: it just kept showing up in new places. The Five Circles of Bitcoin looks at long-term adoption cycles instead of daily price swings. Domain Intelligence is about spotting strategic digital assets before the rest of the market catches on. AI First Gates takes that same lens and points it at emerging industries, hunting for the digital gateways that could define the next era of technological leadership. Different sectors, different tools, same underlying principle: the biggest opportunities only become visible once you zoom out..
AI has changed how fast we can analyse information — what used to take years of manual research now moves in a fraction of the time. But it hasn't replaced human insight. If anything, it's amplified it. Frameworks still matter. Original thinking still matters. Pattern recognition still matters — arguably more now than ever, because the noise has never been louder or faster.
Over the coming months, I'll be revisiting a lot of the frameworks I built over the last two decades — not just to archive them, but to reinterpret them through what's happening in AI today. Some of these started as pure trading concepts, and it turns out they're surprisingly relevant to technology, business, and innovation more broadly. Sometimes the past already holds the blueprint. You just have to go back and read it differently.
Authors NoteMasterCharts began as a trading framework more than a decade ago. Looking back now, I see it as the starting point of a much longer journey — one that eventually led to the Five Circles Framework, Domain Intelligence, and AI First Gates. In a lot of ways, they're all chapters of the same story: learning to spot enduring patterns before everyone else does..
In tomorrow's episode, I'll shift from financial markets to digital real estate and explain why the same structural thinking is helping shape MyDomainPlan, where we have curated more than 10,000 premium domain names, including emerging AI gateway domains designed for the next generation of businesses.
If AI is becoming the operating system of the global economy, then premium domains are becoming its addresses. Understanding those addresses today may prove as valuable as understanding market structure was twenty years ago.
Continue the Journey �� Read the complete Domain Intelligence Weekly series on LinkedIn. �� Explore my complete publishing library: DiamondOlaWalkerMedia.com �� Discover over 10,000 curated premium domains: MyDomainPlan.com �� Premium domains available for acquisition: MyDomainSuperMart.com "Building ideas. Creating value. Inspiring impact."